

Attribution
What the Attribution page reports, the four sections of the page, and which guide to read for each task.
Attribution shows how much of an outcome, for example revenue, your marketing mix models credit to the spend of each channel, tactic, and campaign. The page puts the modeled figures next to the figures that your ad platforms and your sales sources report for the same period.
To open Attribution, select Attribution in the Marketing group of the sidebar.
What does Attribution answer?
Section titled “What does Attribution answer?”Attribution answers three questions about a period that you select.
- How much did you spend, and what outcome do your sales sources report?
- How much of the outcome do your models attribute to paid media, by channel, tactic, and campaign?
- How does the modeled figure of a channel compare with the figure that the ad platform reports for itself?
Which figures does the page compare?
Section titled “Which figures does the page compare?”The page shows three kinds of figure. The modeled figure divides into two parts, Base and Halo.
- Your sales sources reportReportedThe total outcome that your connected sales sources record. The figure is not divided by channel.
- Each ad platform reportsChannel ReportedThe outcome that each ad platform claims for itself. Each platform takes full credit, so the figures overlap.
- The marketing mix model estimatesModeled (MMM)The outcome that the model attributes to the spend of each channel, tactic, or campaign.
- BaseThe outcome that the spend drives directly.
- HaloThe outcome that the spend drives indirectly, through other channels and sources.
Read Modeled and reported figures for the full explanation.
What are the sections of the page?
Section titled “What are the sections of the page?”The page has a filter bar and four sections. The filter bar stays at the top of the page while you scroll.
| Section | What it shows |
|---|---|
| Summary cards | The headline totals for the selected period. The cards have no section title on the page. |
| Attribution Over Time | A chart of one or two metrics across the selected period. |
| Performance Table | A table of metrics by channel, tactic, or campaign. |
| Base & Halo Flows | A chart of how the modeled outcome of each channel divides into Base and Halo. |
Example: Attribution Over Time
Section titled “Example: Attribution Over Time”Each section is a card with a title, its controls, and its data. The capture shows the Attribution Over Time section with the breakdown by channel.
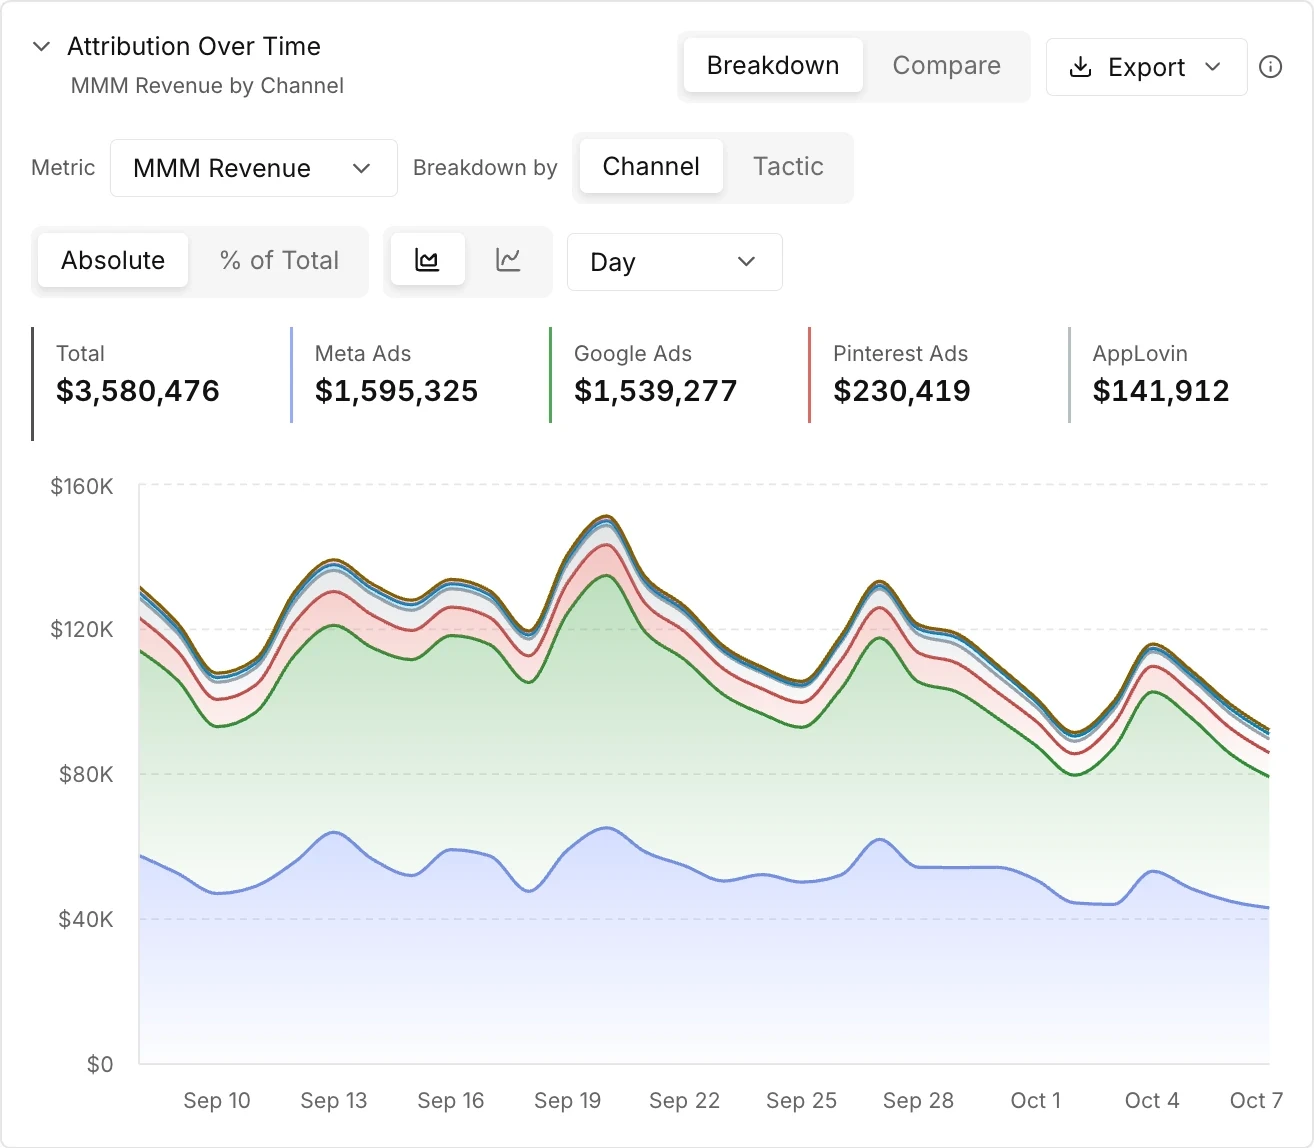
You can move a section up or down and collapse a section. See Arrange the page.
What does the page show during onboarding?
Section titled “What does the page show during onboarding?”During onboarding, Attribution can open before your models are approved. The page then shows only your reported data, with the notice Your reported data is ready to review.
In this state, the page has no modeled figures. The summary cards show spend, the reported outcome, and for a revenue target a Channel Reported card. The chart section has the title Reported Over Time. The Base & Halo Flows section, the Model control, and the Views menu do not appear.
Next steps
Section titled “Next steps”- Choose what the page shows: set the target, the models, the date range, and the filters.
- Compare two periods: see the change from an earlier period.
- Compare channels, tactics, and campaigns: read the Performance Table.
- Explore a spend scenario: read the saturation curve of a row.
- Save and share a view: keep a set of columns and filters.
- Export Attribution data: download a CSV from each section.
Reference
Section titled “Reference”The reference pages of Attribution are in the Reference tab. Each page lists the exact labels, options, limits, and messages of one screen.
- Page controls: the filter bar, the date range, and the comparison control.
- Filters and views: the filters of the page and the saved views.
- Metrics and summary cards: the summary cards and each metric of the page.
- Attribution Over Time options: the modes, granularity, types, and controls of the chart.
- Performance Table options: the levels, columns, export options, and row details of the table.
- Base & Halo Flows options: the chart types, the flow filter, and the grouping tabs of the section.
For the meaning of a term, see the Glossary.