

Read the health of a model
Open one model, switch between the Current Fit view and the Backtest view, and read the metrics and the chart of each view.
The Model Health tab of a model shows how closely the model follows your reported results. The tab has two views. Current Fit shows the current model through its latest date. Backtest shows a separately trained model, with a score for the dates that the model did not train on.
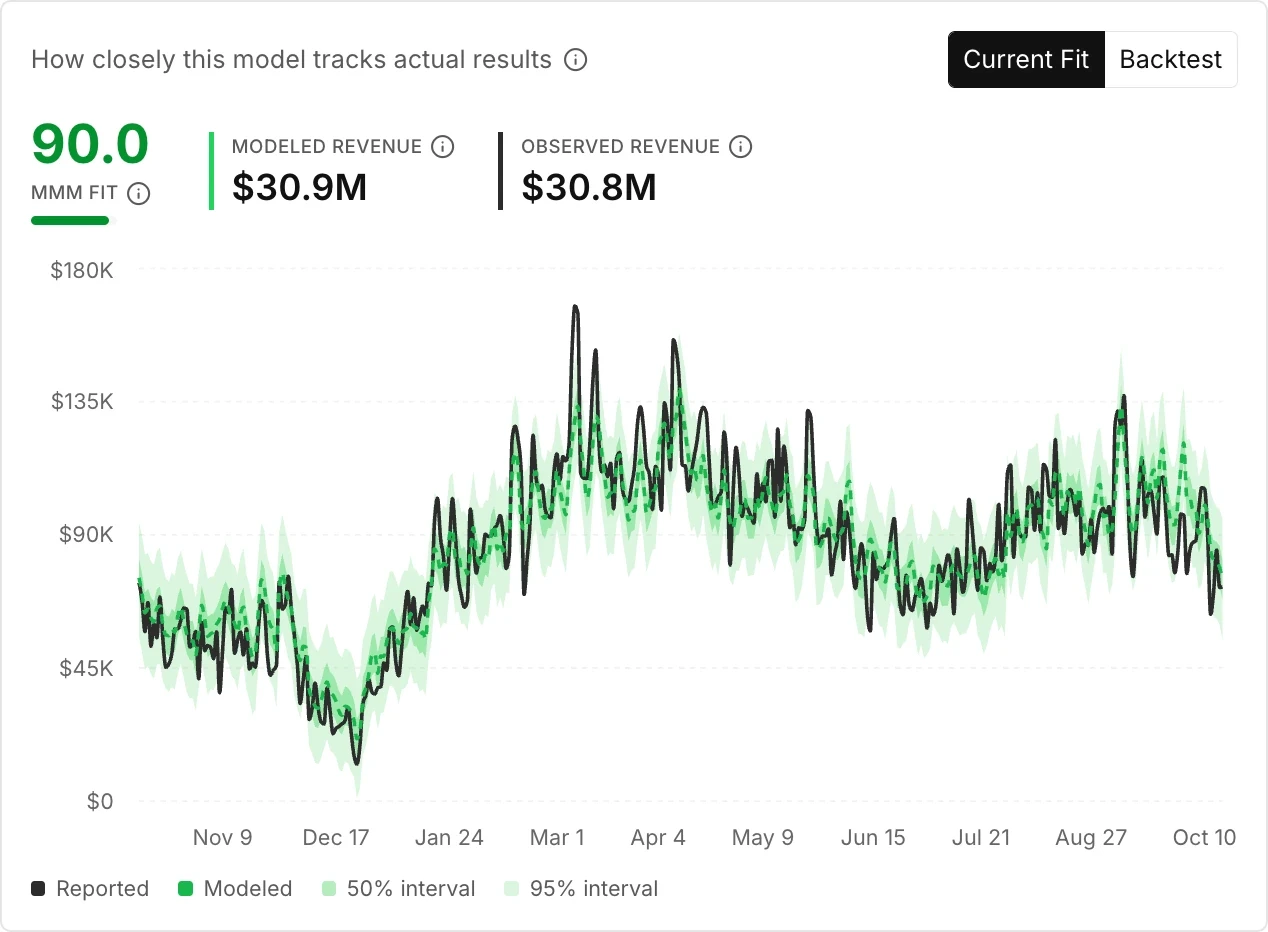
The capture shows the Model Health tab in the Current Fit view.
In a label on this page, a word in braces is a value from your account.
Open the Model Health tab
Section titled “Open the Model Health tab”-
Select Model Center in the sidebar.
-
Select the card of the model.
The detail page opens on the tab that you used last. The first time, it opens on Model Health. Select Model Health if a different tab shows. The tab opens in the Current Fit view.
-
In the page header, select the period that you want to read.
Read the Current Fit view
Section titled “Read the Current Fit view”Use Current Fit to see how the model that produces your results today follows your reported totals.
-
Read MMM Fit. The value runs from 0 to 100, and a higher value is better.
-
Compare Modeled {target} with Observed {target}. The first is the total that the current model predicted. The second is the total that your sources recorded.
-
Read the chart. The Reported line is what your sources reported. The Modeled line is what the model predicted.
When the model has them, the chart also shows a 50% interval band and a 95% interval band around the modeled line. The label of the wider band can read Interval.
Read the Backtest view
Section titled “Read the Backtest view”Use Backtest to see how a separately trained model does on dates that it did not learn from.
-
Select Backtest in the toggle above the metrics.
-
Read Model Accuracy. In this view, the value is the fit of the backtest model on the dates that it trained on. The value runs from 0 to 100, and a higher value is better.
-
Compare Modeled {target} with Observed {target}. The product says that the closer the modeled value is to the observed value, the more accurate the model is.
-
If the view shows Non-trained Accuracy, read that value. It is the score for the dates that the model did not train on: the most recent period of about 30 days. The value stays the same when you change the period.
-
If the view shows Non-trained Forecast vs Observed, compare the two values. The first is what the model forecast for that period. The second is what happened.
-
Hold the pointer over the chart to see the Forecast value and the Reported value for a date.
How do the two views differ?
Section titled “How do the two views differ?”The two views cover different dates and use different models. For the diagram and the explanation, see Accuracy and fit.
If a view has no data
Section titled “If a view has no data”- Current Fit shows No fit data available for this configuration. when the config has no fit data.
- Backtest shows No backtest results available yet. when the config has no backtest.
For Current Fit, select a longer period.
Next steps
Section titled “Next steps”- Model Health reference: each metric, chart series, and status.
- Compare two configs: see two configs of a model side by side.