

Model Center
What Model Center shows about your marketing mix models, what you can and cannot do there, and which guide to read for each task.
Model Center is where you check the marketing mix models behind your results. For each model, the page shows a Model Accuracy score, how the modeled totals compare with your reported totals, and the last date that the model has results for.
The capture shows the Model Center overview, with the summary cards and a card for each model.
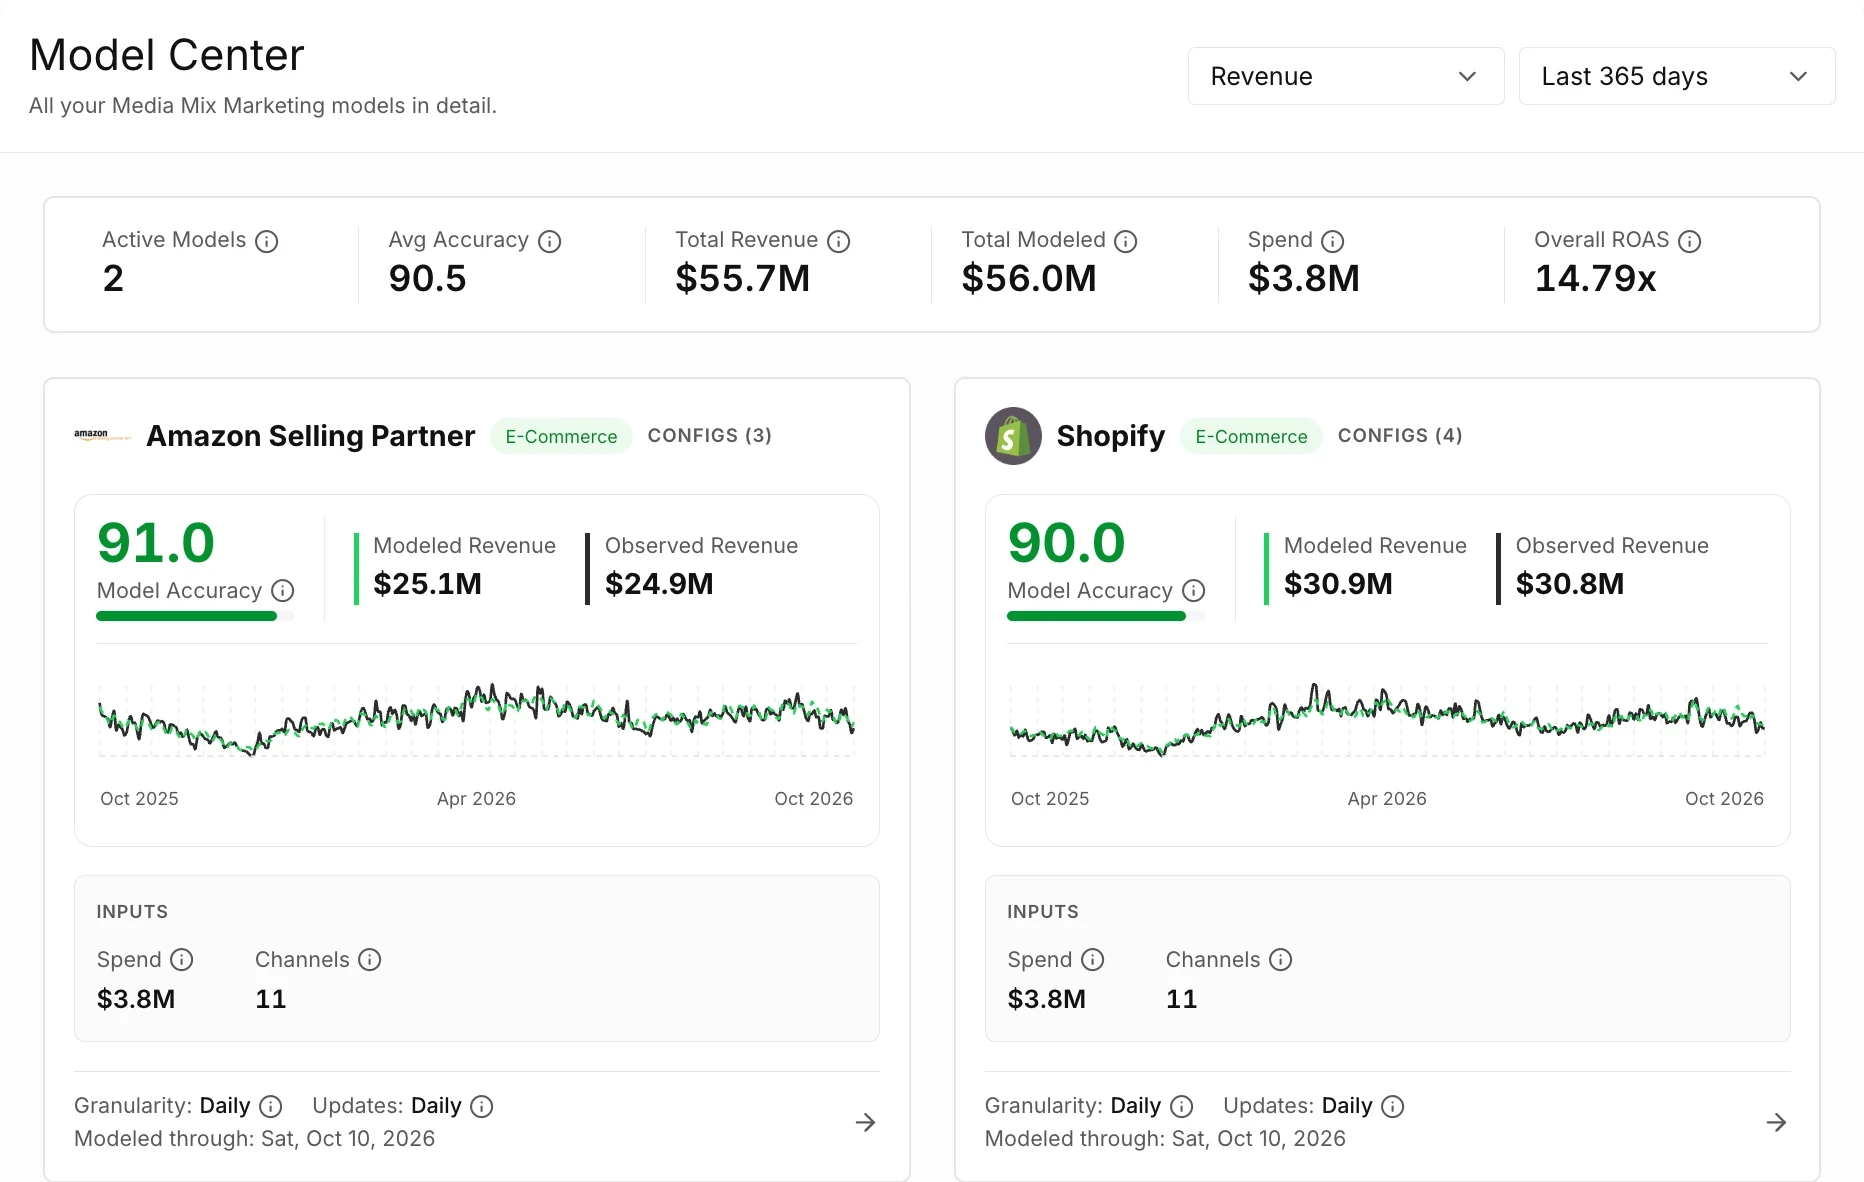
To open Model Center, select Model Center in the sidebar.
What does Model Center answer?
Section titled “What does Model Center answer?”Model Center answers three questions about your models.
- What is the Model Accuracy score of each model, on a scale from 0 to 100?
- How closely do the modeled values follow the values that your sources reported?
- How current is each model?
What is on the overview?
Section titled “What is on the overview?”The overview has a summary strip and one card for each model. Two selectors in the page header set what the page shows: the target, for example revenue, and the period.
| Summary tile | What it shows |
|---|---|
| Active Models | The number of models that serve the selected target. |
| Avg Accuracy | The mean Model Accuracy of the models that have a Default config. |
| Total {target} | The total of the reported values for the selected period. |
| Total Modeled | The total of the modeled values for the selected period. |
| Spend | The total media spend for the selected period. |
| Overall {efficiency} | The efficiency of the selected target for the period. The metric depends on the target, for example ROAS or CAC. |
A word in braces stands for a value from your account or your plan.
Each card shows one model. A model measures one target for one channel. The figures that the models attribute to your spend are in Attribution.
| Card field | What it shows |
|---|---|
| Model Accuracy | The fit of the model for the selected period, from 0 to 100, with 1 decimal. It is the same figure as MMM Fit in the Current Fit view of the detail page. A dash shows when no score exists. |
| Modeled {target} | The total that the model predicted for the selected period. |
| Observed {target} | The total that your sources reported for the selected period. |
| Spend | The total media spend of all channels for the selected period. |
| Channels | The number of media channels for the selected period. |
| Granularity: | Daily or Weekly. The time unit of the data of the model. |
| Updates: | Daily or Weekly. The card shows the same value as Granularity:. |
| Modeled through: {date} | The last date that the model has results for. A dash shows when the model has no results. |
A word in braces stands for a value from your account or your plan.
Select a card to open the detail page of that model.
What is on a detail page?
Section titled “What is on a detail page?”A detail page shows one model in two tabs.
| Tab | What it shows |
|---|---|
| Model Health | The fit of the model against reported results. The page opens on this tab the first time. |
| Attribution | The Attribution sections for this one config. |
The detail page also has the Compare configs button. When a model has more than one config, the page has a config selector too. Read Configs and the Preference Score for what a config is.
What can you change in Model Center?
Section titled “What can you change in Model Center?”Model Center is a place to read your models. You can change what the page shows: the target, the period, the config, and the tab.
Next steps
Section titled “Next steps”- Check how accurate a model is: read the Model Accuracy score of each model.
- Read the health of a model: use the Current Fit view and the Backtest view.
- Find how current a model is: read the Modeled through date and the run status.
- See the attribution of one model: open the Attribution results of one config.
- Compare two configs: use Model Comparison.
For the ideas behind the scores, see Accuracy and fit.
Reference
Section titled “Reference”The reference pages of Model Center are in the Reference tab. Each page lists the exact labels, options, limits, and messages of one screen.
- Overview reference: the overview page: the header, the summary strip, the model cards, and the empty states.
- Model Health reference: the detail page of a model and its Model Health tab.
- Model Comparison reference: the Model Comparison page: selectors, timeframes, the selection criteria, and the results sections.
For the meaning of a term, see the Glossary.