

Metrics and summary cards
Reference for the Attribution summary cards and metric columns, with the source of each figure and the tooltip text of each card and column.
This page lists the summary cards and the metrics of the Attribution page. For the options of each section, see Attribution Over Time options, Performance Table options, and Base & Halo Flows options.
In a label on this page, a word in braces is a value that depends on the account. The outcome is the name of the target, for example revenue. The efficiency is the efficiency metric of the target, for example ROAS.
Summary cards
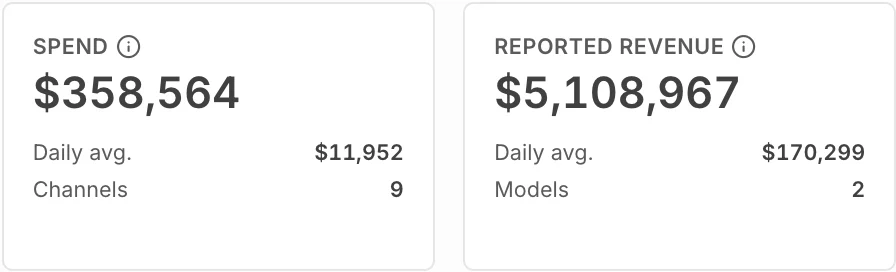
Section titled “Summary cards”The first two cards show spend and the reported outcome.
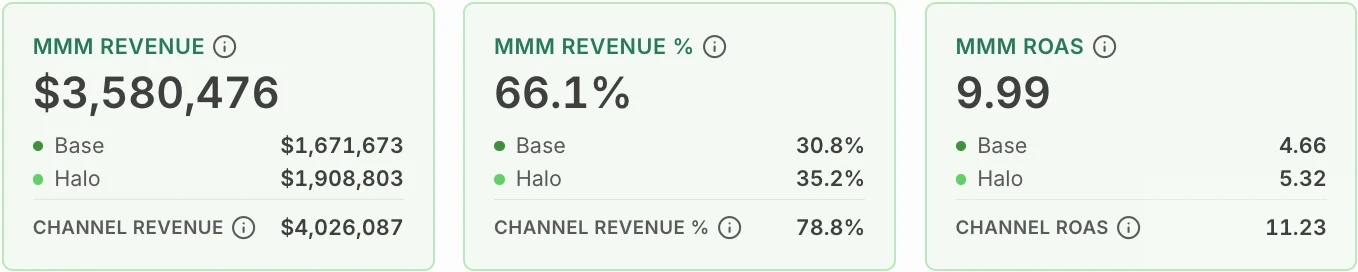
The other cards show the modeled figures, each with its Base part and its Halo part.
| Card | What it shows |
|---|---|
| Spend | The total ad spend for the period, with Daily avg. and the number of Channels. |
| Reported {outcome} | The outcome that your connected sales sources report, with Daily avg. and the number of Models. |
| MMM {outcome} | The total outcome that the marketing mix model attributes to paid media, divided into Base and Halo. |
| MMM {outcome} % | The share of the total predicted outcome that the model attributes to paid media, divided into Base and Halo. |
| MMM {efficiency} | The modeled efficiency against spend, divided into Base and Halo. The efficiency metric depends on the target, for example ROAS or CAC. |
A word in braces stands for a value from your account or your plan.
| Rule | Value |
|---|---|
| No serving model | The MMM cards show a dash when the selected scope has no model. |
| Reported revenue | The Reported card counts transactional revenue only. Subscription revenue and wholesale revenue are not included. |
| Comparison | With Compare on, each card shows the change from the comparison period. |
Tooltips of the summary cards
Section titled “Tooltips of the summary cards”The table gives the text that the product shows when the pointer is over a card title.
| Card | Tooltip |
|---|---|
| Spend | Amount spent on advertising channels. |
| Reported {outcome} | {Outcome} numbers provided by {connector names} data connectors. |
| MMM {outcome} | Total {outcome} attributed to paid media by the Marketing Mix Model (Base + Halo). |
| MMM {outcome} % | Percentage of total predicted {outcome} attributed to paid media by the MMM model. |
| MMM {efficiency} | {Efficiency} — modeled {outcome} efficiency against spend (Base + Halo). |
| Channel {outcome} % | Channel-reported {outcome} as % of actual total {outcome}. |
| Channel ROAS | Channel-reported revenue ÷ spend. |
A word in braces stands for a value from your account or your plan.
Metrics
Section titled “Metrics”Metric groups
Section titled “Metric groups”| Group | Source of the figures |
|---|---|
| Spend | The data input. This group has no band label in the table. |
| Modeled (MMM) | Figures from the marketing mix model: total, Base, and Halo. |
| Channel Reported | Figures that each ad platform reports for itself. |
| One band for each model | With 2 or more models, each model has a band with its own modeled columns. The band has the name of the model. |
Metric columns
Section titled “Metric columns”| Metric | What it shows |
|---|---|
| Spend | Media spend for the period, as the ad platform reports it. |
| MMM {outcome} | The total modeled outcome for the spend: Base plus Halo. |
| MMM {efficiency} | The efficiency of the total modeled outcome against spend. |
| MMM Base {outcome} | The modeled outcome that the spend of the row drives directly. |
| MMM Base {efficiency} | The efficiency of the Base outcome against spend. |
| MMM Halo {outcome} | The modeled outcome that the spend of the row drives indirectly, through other channels and sources. |
| MMM Halo {efficiency} | The efficiency of the Halo outcome against spend. |
| Channel {outcome} | The outcome that the ad platform reports for itself, before modeling. Revenue targets only. |
| Channel {efficiency} | The efficiency of the channel-reported outcome against spend. Revenue targets only. |
| Impressions | The number of times an ad was served, as the ad platform reports it. |
| Clicks | Ad clicks, as the ad platform reports them. |
| CPM | Cost per thousand impressions: spend divided by impressions, multiplied by 1,000. |
| CPC | Cost per click: spend divided by clicks. |
| Campaign ID | The campaign identifier of the ad platform. The column is blank on the Channels and Tactics tabs. |
| MMM {outcome} % | The share of the row in the table total of MMM {outcome}. The summary card with the same name shows a different figure. |
| Channel {outcome} % | The share of the row in the table total of Channel {outcome}. Revenue targets only. |
A word in braces stands for a value from your account or your plan.
| Rule | Value |
|---|---|
| Efficiency direction | For a ratio such as ROAS, a higher value is better. For a cost such as CAC, a lower value is better. |
| Channel-reported outcome | Channel {outcome} and Channel {efficiency} are available for revenue targets only. |
| Per-model columns | With 2 or more models, each model has its own columns for the modeled outcome and efficiency, with Base and Halo. |
A word in braces stands for a value from your account or your plan.
Metrics of the chart only
Section titled “Metrics of the chart only”Attribution Over Time has these metrics. The Performance Table has no column for them, because the figures are not divided by channel, tactic, or campaign.
| Metric | What it shows |
|---|---|
| Reported {outcome} | The outcome that your connected sales sources report, before modeling. The chart has one such metric for each target of your account. |
| Reported {efficiency} | The reported outcome against the total media spend, for example Reported ROAS. The metric shows when the target has an efficiency metric. |
| Reported Orders | The orders that your connected sales sources report. |
| Reported Average Order Value | Reported revenue divided by reported orders. |
| Web Users | Website users, from your Google Analytics connection. |
| Web Sessions | Website sessions, from your Google Analytics connection. |
| Web Bounce Rate | The share of sessions that bounced, from your Google Analytics connection. |
A word in braces stands for a value from your account or your plan.
Tooltips of the metric columns
Section titled “Tooltips of the metric columns”The table gives the text that the product shows when the pointer is over a column header.
| Metric | Tooltip |
|---|---|
| Spend | Media spend for the selected period, as reported by the advertising platform. |
| MMM {outcome} | Total modeled {outcome} the MMM credits to this spend over the selected period — Base plus Halo. |
| MMM Base {outcome} | Modeled {outcome} driven directly by this row's own spend — the first-order effect. |
| MMM Halo {outcome} | Modeled {outcome} this spend drove indirectly, by lifting other channels and sources — the second-order (halo) effect. |
| Channel {outcome} | {Outcome} the advertising platform claims for itself, before any modeling. Platforms each take full credit, so these overlap and typically total more than the modeled figure. |
| CPM | Cost per thousand impressions — spend ÷ impressions × 1,000. |
| CPC | Cost per click — spend ÷ clicks. |
A word in braces stands for a value from your account or your plan.
Related
Section titled “Related”- Attribution: the guides and the concepts of the product area.
- Compare channels, tactics, and campaigns: the steps to read the metrics in the table.
- Modeled and reported figures: what each kind of figure counts.