

Read plan results
How to check the goal of a finished Media Forecaster plan, see where the budget moves, track actual results, and export the numbers.
To read a plan, open a plan with the status Ready from the plans list. The plan page shows the settings of the plan, a row of summary cards, the Performance Over Time section, and the Media Breakdown table.
How do you check whether the plan reaches the goal?
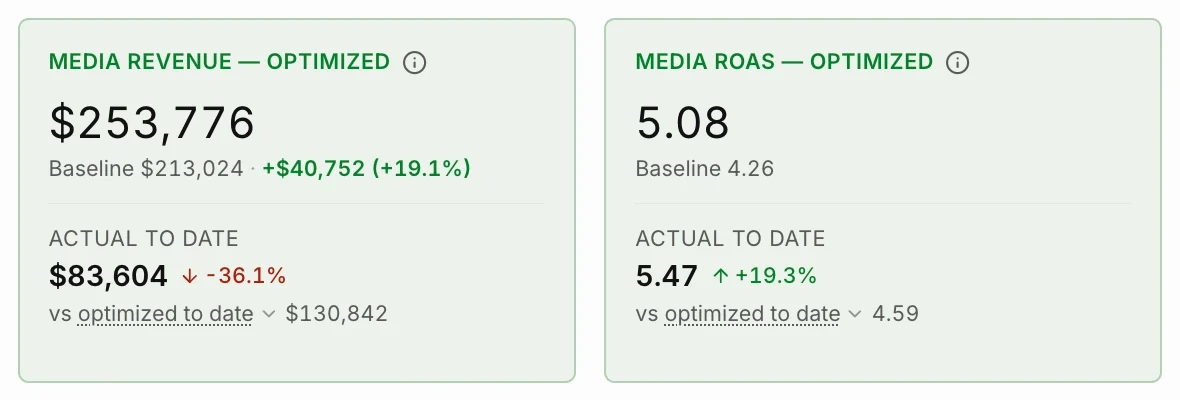
Section titled “How do you check whether the plan reaches the goal?”The summary cards at the top of the plan page compare the optimized plan with the baseline. The two cards with titles that end in Optimized show the modeled result of the plan.
-
Open the plan from the plans list.
-
If the goal has a target, read the target card.
The card reads Target Hit, Target Missed, or Target · Directional. The card shows the achieved value, Recommended spend, and Max budget. A card that reads Target Missed can also show Gap.
Target · Directional means that the estimate reaches the target at a spend that is more than your models have seen. Read the result as a direction, not as a firm forecast.
-
Read the Spend card.
Plan Budget is the total spend that the optimized plan recommends for the whole period.
-
Read the two cards with titles that end in Optimized.
The first card shows the modeled outcome of the optimized plan and the lift over the baseline. The second card shows the efficiency ratio that the outcome and the spend imply.
Each of the three comparison cards also shows Actual to date. The two optimized cards show the Baseline value below the optimized figure. The Spend card shows Plan Budget there, not a baseline value. The Period card shows the planning period and how far the period has progressed.
How do you see where the budget moves?
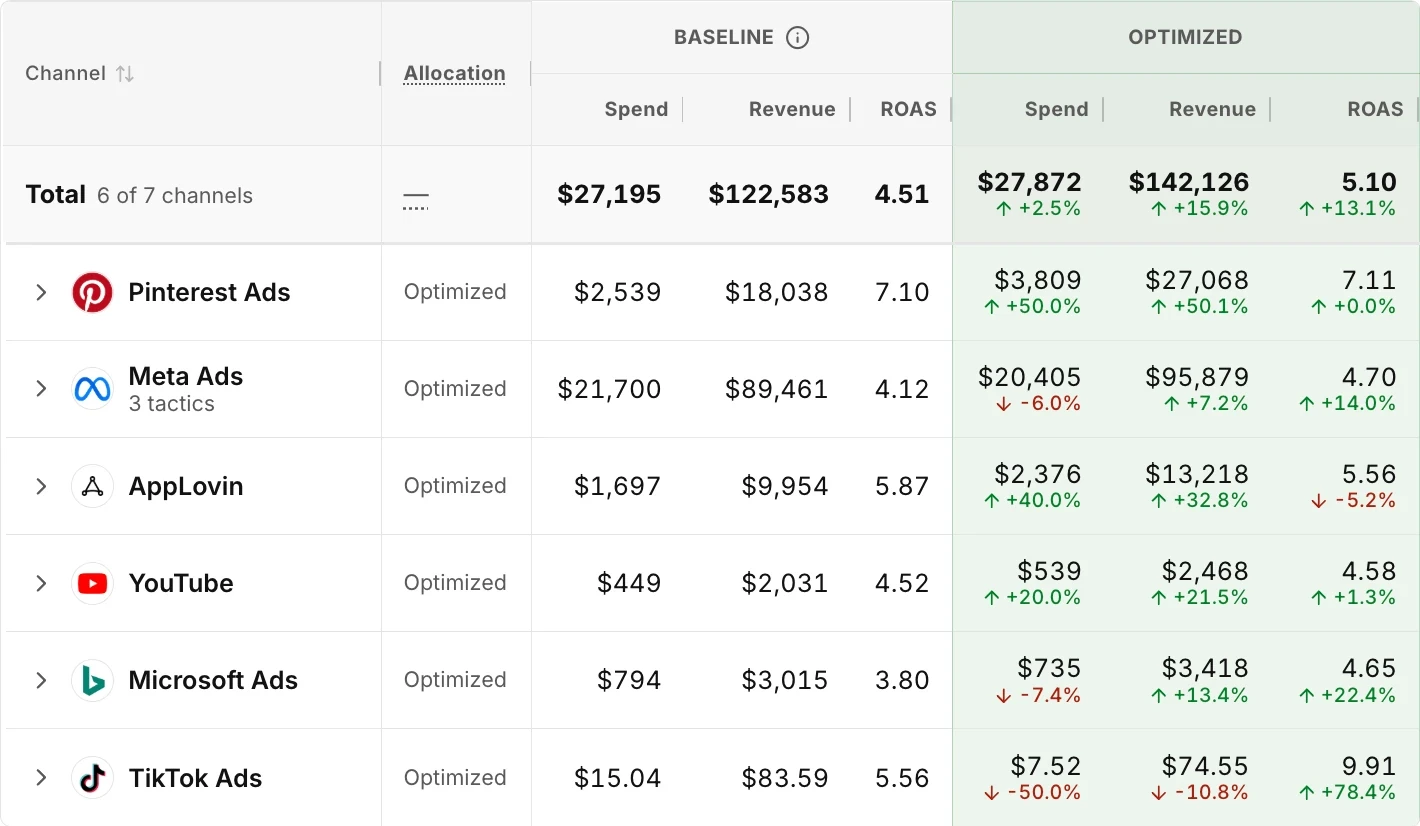
Section titled “How do you see where the budget moves?”The Media Breakdown table shows the baseline and the optimized values for each row, so the difference is the budget move that the plan recommends.
The controls above the table set the rows and the format of the table.

The next capture shows the Channel tab. The channel filter in the capture shows six of the seven channels of the plan, so the Total row reads 6 of 7 channels.
-
Go to Media Breakdown.
-
Select the Channel, Tactic, or Campaign tab.
The Campaign tab is available on an Optimization plan only.
-
Compare the Baseline columns with the Optimized columns for each row.
Use the % and $ toggle to show each change as a percentage or as a currency amount.
-
Read the Allocation column to see the limits that you set.
A row with no limit reads Optimized. A row with a limit shows the amount. An underlined amount means that the optimizer reached the limit.
-
Expand a row to see the rows under it and the saturation curve of a tactic or campaign.
On an Optimization plan, the Campaign tab also has a marginal column, for example Marginal ROAS. The marginal column shows the modeled return from the next unit of spend at the recommended spend. The name of the column depends on the goal of the plan.
How do you see the plan for each day or week?
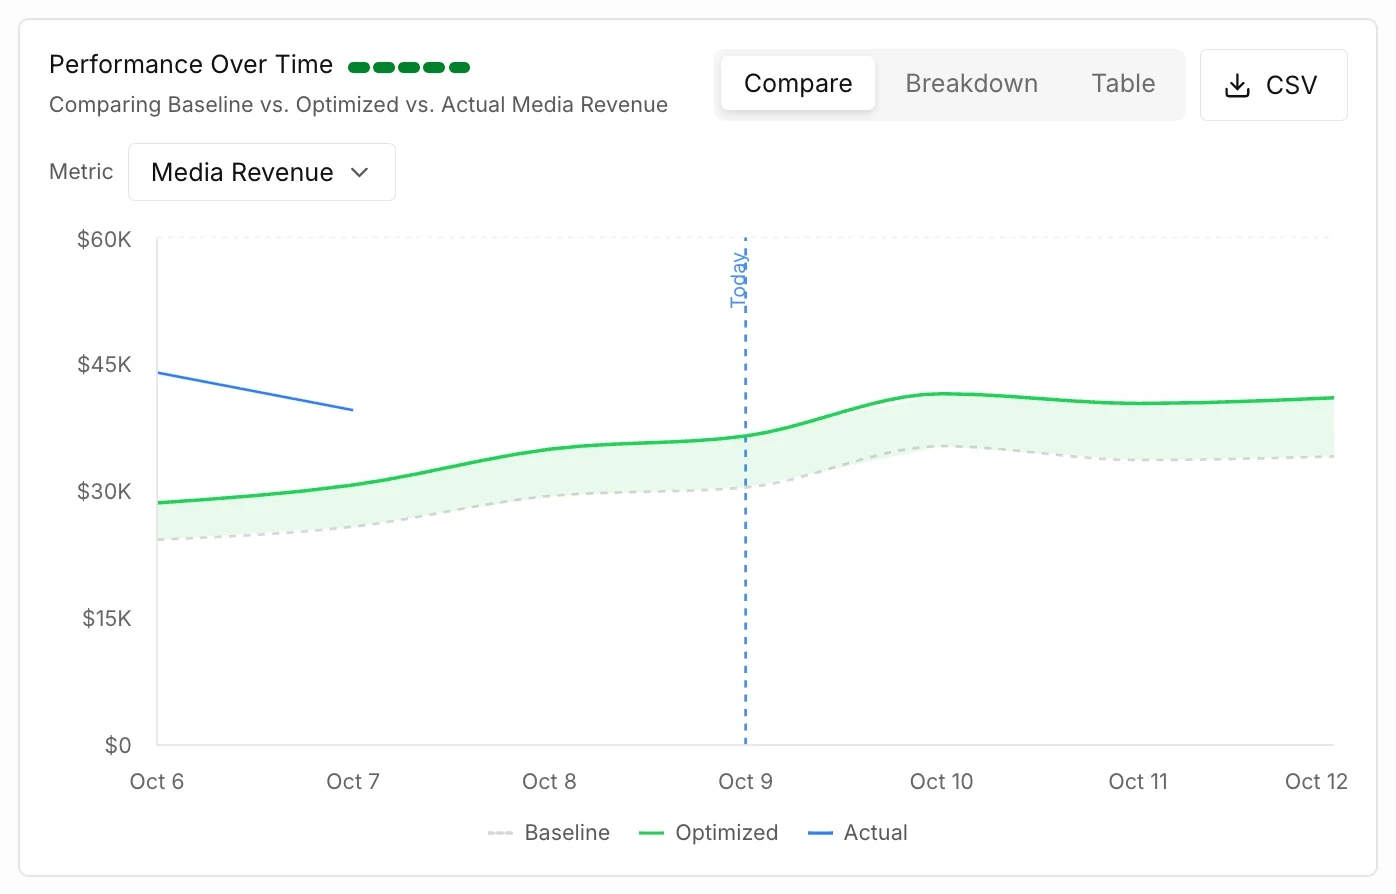
Section titled “How do you see the plan for each day or week?”The Performance Over Time section shows the plan for each day or week of the planning period.
-
Go to Performance Over Time.
-
Select a view: Compare, Breakdown, or Table.
Compare charts the Optimized, Baseline, and Actual series. Breakdown splits the chart by channel, tactic, or model. Table shows one row for each period.
-
Select the metric to show: the outcome, Media Spend, or the efficiency ratio.
How do you track actual results against the plan?
Section titled “How do you track actual results against the plan?”Use the Pacing menu in Media Breakdown to compare your actual results with the plan while the planning period runs.
-
In Media Breakdown, select Pacing.
-
Turn on Show actual-to-date columns.
-
In Compare actual against, select Optimized plan or Baseline plan.
-
In Over, select Expected to date or Full plan period.
Expected to date adds up the values of the plan for each period through today. A plan that spends more in later periods is therefore not compared with an even daily split.
How do you view the results for one model?
Section titled “How do you view the results for one model?”On a plan with more than one model, select a model chip in the plan header to exclude or include the model. The page then shows Viewing a slice. Select Reset to return to the full plan.
In a filtered view, the modeled results count the selected models only. Spend stays the full spend of the plan. The filter is part of the page address, so you can share the filtered view as a link.
How do you export plan results?
Section titled “How do you export plan results?”Both results sections have a CSV menu.
- In Media Breakdown, select CSV. The menu has two headings. Below Plan totals, select an item to export the rows on screen. Below the daily or weekly schedule heading, select an item to export the plan for each period. The file name starts with
media_breakdown_and has the plan name and the date. - In Performance Over Time, select CSV to export the daily or weekly schedule. The menu has Plan total and one item for each breakdown that the plan has: By channel, By tactic, By campaign, and By model. By campaign shows when the plan has campaign rows, which is the case for an Optimization plan. Plan total and the By items are below a heading that reads Daily schedule or Weekly schedule. Each item downloads one file. The file name starts with
daily_schedule_orweekly_schedule_and has the plan name, the breakdown, and the date. A filtered view adds_filtered_modelsor_filtered_channelsto the name.
Related pages
Section titled “Related pages”- Plans list and plan results lists every card, column, and menu on the plan page.
- How Media Forecaster builds a plan explains baseline, optimized, and actual to date.