

Check how accurate a model is
Find the Model Accuracy score of each model on the Model Center overview, and compare the modeled total with the observed total.
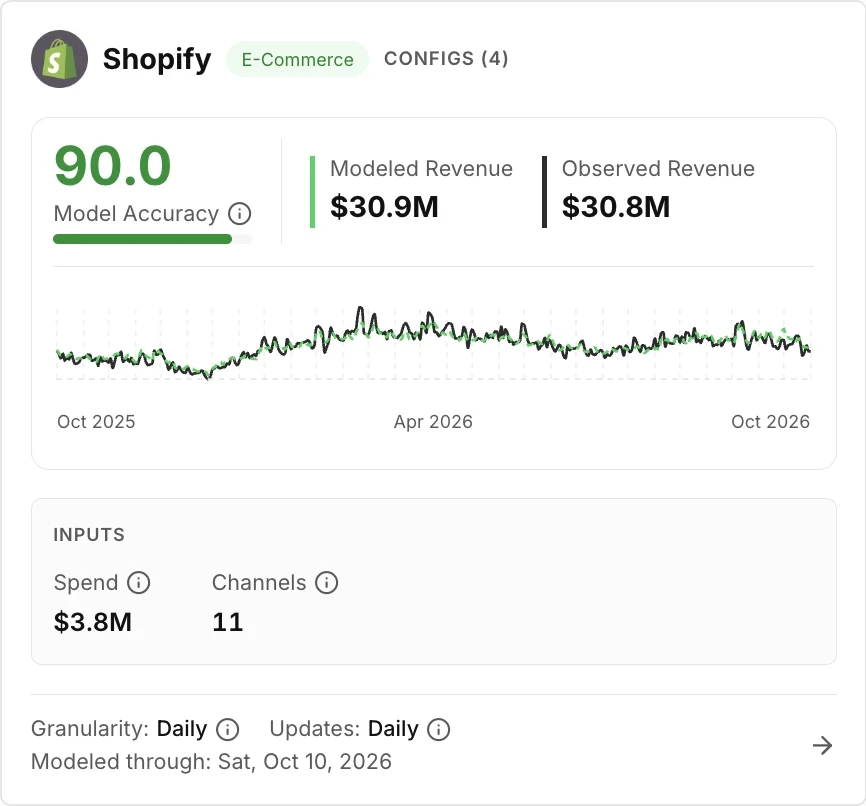
The Model Accuracy score on each card of the Model Center overview tells you how closely that model follows your reported results in the selected period. The score runs from 0 to 100, and a higher score is better. It is the same figure as MMM Fit on the detail page of the model.
The capture shows one model card of the overview, with Model Accuracy at the top left.
In a label on this page, a word in braces is a value from your account. The target is the outcome that the model measures, for example revenue.
Find the score of each model
Section titled “Find the score of each model”-
Select Model Center in the sidebar.
-
In the page header, select the target that you want to check.
The overview shows one card for each model of that target.
-
In the page header, select the period.
The period sets the dates for the score, the totals, and the chart on each card.
-
Read Model Accuracy on each card.
The score has a color. See the table that follows.
| Color | Score | When it shows |
|---|---|---|
| Green | 70 or more | The score is 70 or more. |
| Orange | 60 to less than 70 | The score is 60 or more and less than 70. |
| Red | Less than 60 | The score is less than 60. |
Compare the score with the totals
Section titled “Compare the score with the totals”The score is one number. The two totals next to the score show how far the model is from your reported results in the selected period.
-
On a card, read Modeled {target}. This value is the total that the model predicted.
-
Read Observed {target}. This value is the total that your sources reported.
-
Look at the chart on the card. The solid line is the reported value. The dashed green line is the modeled value.
When the two lines stay close together, the model follows your reported results in that period.
Read the average for a target
Section titled “Read the average for a target”The Avg Accuracy tile in the summary strip gives the mean score of the models of the selected target.
If a card has no chart
Section titled “If a card has no chart”A card shows a message when the card cannot draw a chart for the selected period.
| Message | What to do |
|---|---|
| Not enough history to chart | The model has fewer than 2 data points in the selected period. Select a longer period. |
| No fit data for this period | The model has results, but none of the results are in the selected period. Select a longer period. |
| No modeled data yet | The model has no results yet. |
Check a model on dates that it did not train on
Section titled “Check a model on dates that it did not train on”The score on a card is for a period that includes data that the model learned from. For a score on dates that a model did not train on, open the model and read Non-trained Accuracy in the Backtest view. See Read the health of a model.
Next steps
Section titled “Next steps”- Read the health of a model: see the fit of one model in detail.
- Accuracy and fit: learn what each score measures.