

Compare channels, tactics, and campaigns
How to use the Performance Table to rank channels, tactics, and campaigns, change the columns, and open the details of one row.
The Performance Table lists spend, modeled results, and reported results for each channel, tactic, or campaign in the selected period. Use the table to find which rows return the most and which rows the ad platforms rate differently from your models.
How do you rank channels, tactics, or campaigns?
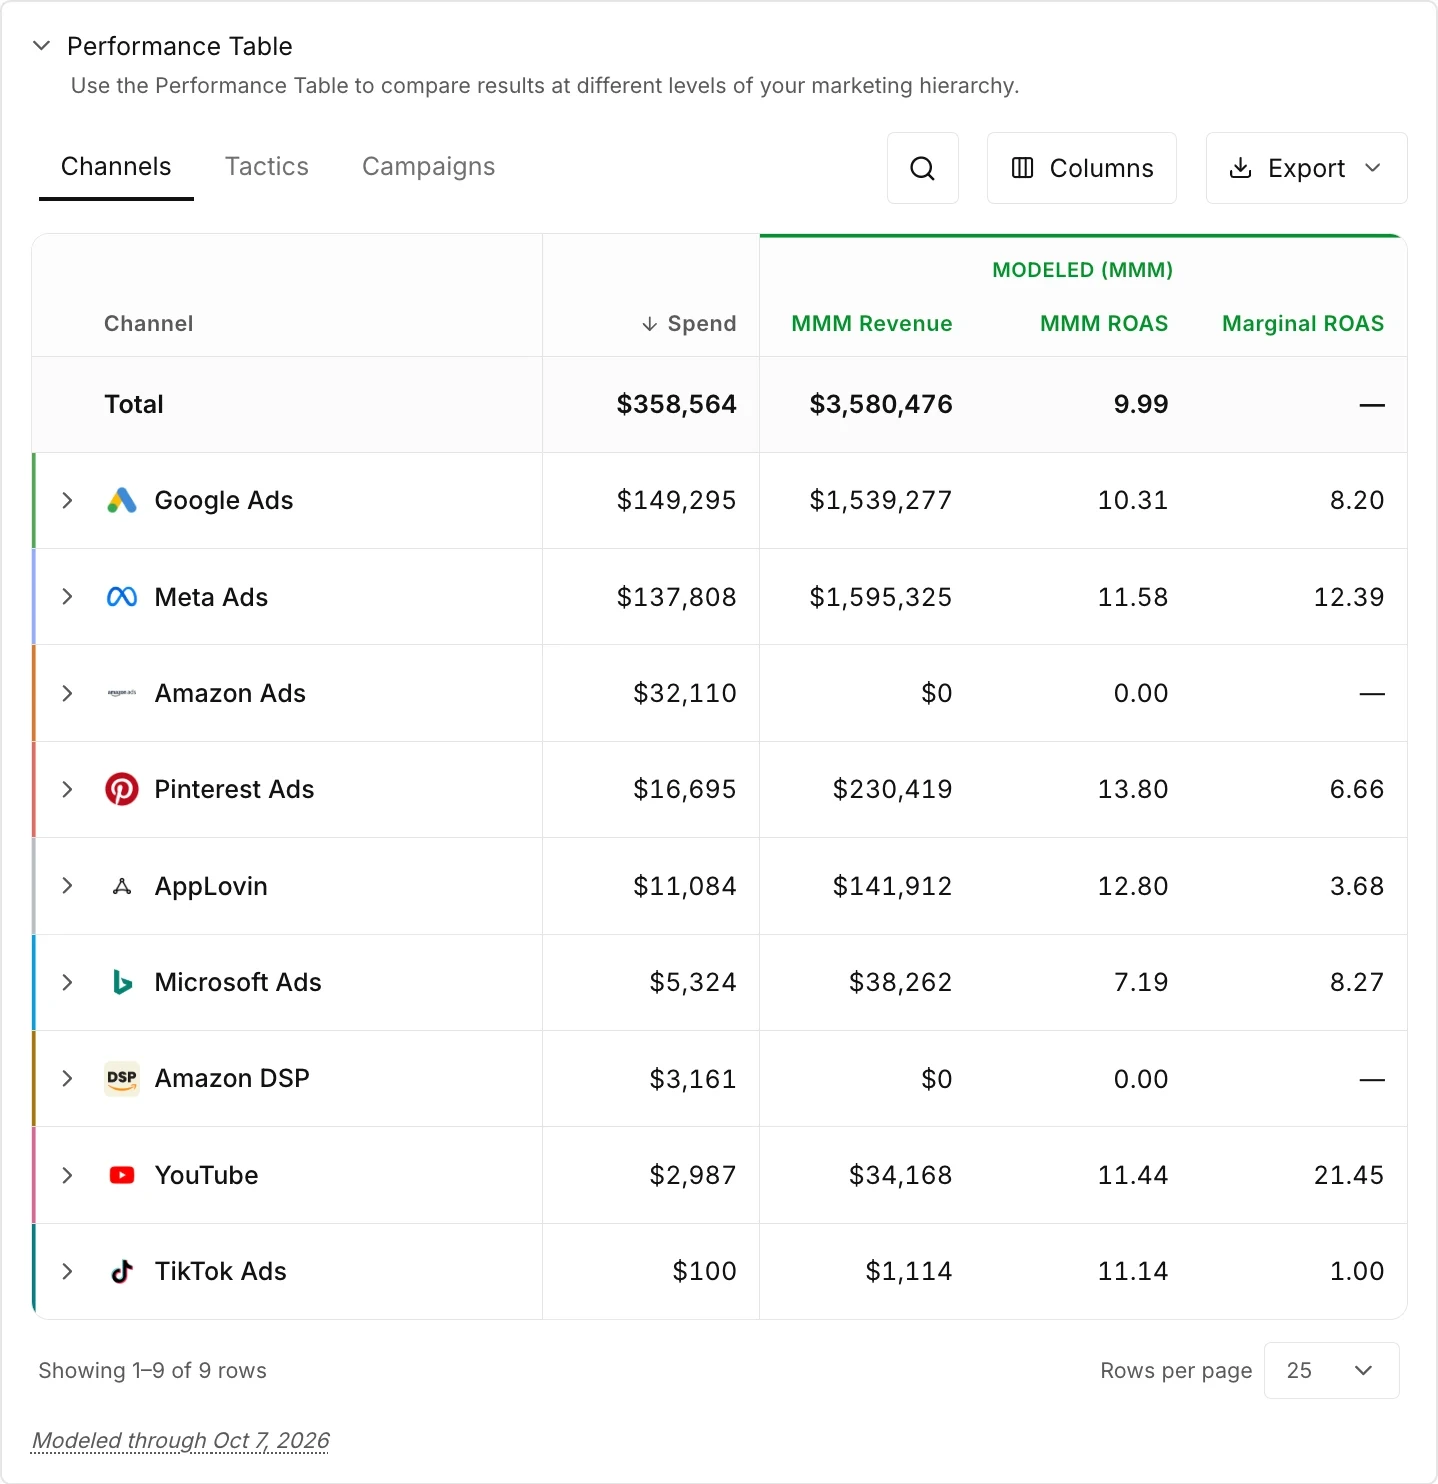
Section titled “How do you rank channels, tactics, or campaigns?”Each row of the table is one channel, tactic, or campaign. The capture shows the Channels tab with the spend column and the modeled columns.
-
Go to the Performance Table section of Attribution.
-
Select a tab: Channels, Tactics, or Campaigns.
-
Select a column heading to sort by the column.
The table opens sorted by Spend, from high to low. Select the heading again to reverse the order. With Compare on, a metric column then sorts by the change, from high to low and from low to high, before it returns to the value.
-
To find one row, select the search button and type a name.
-
To see more rows on one page, change Rows per page under the table.
The Total row shows the total of each metric across the rows of the table. The Marginal column and Campaign ID are blank in this row.
The table opens with Spend, the modeled outcome and efficiency, the Marginal column, and the channel-reported outcome and efficiency. The names of the columns depend on the target of your account. For a revenue target, the columns can read MMM Revenue, MMM ROAS, Marginal ROAS, Channel Revenue, and Channel ROAS.
How do you see the campaigns of one channel or tactic?
Section titled “How do you see the campaigns of one channel or tactic?”Select the name of a row on the Channels tab or the Tactics tab. The table opens the Campaigns tab with only the campaigns of that row. A banner above the table names the row.

To see all campaigns again, select Clear filter in the banner.
The tactic of a campaign is the label that you give the campaign in Data Center. See Label campaigns with tactics.
How do you change the columns?
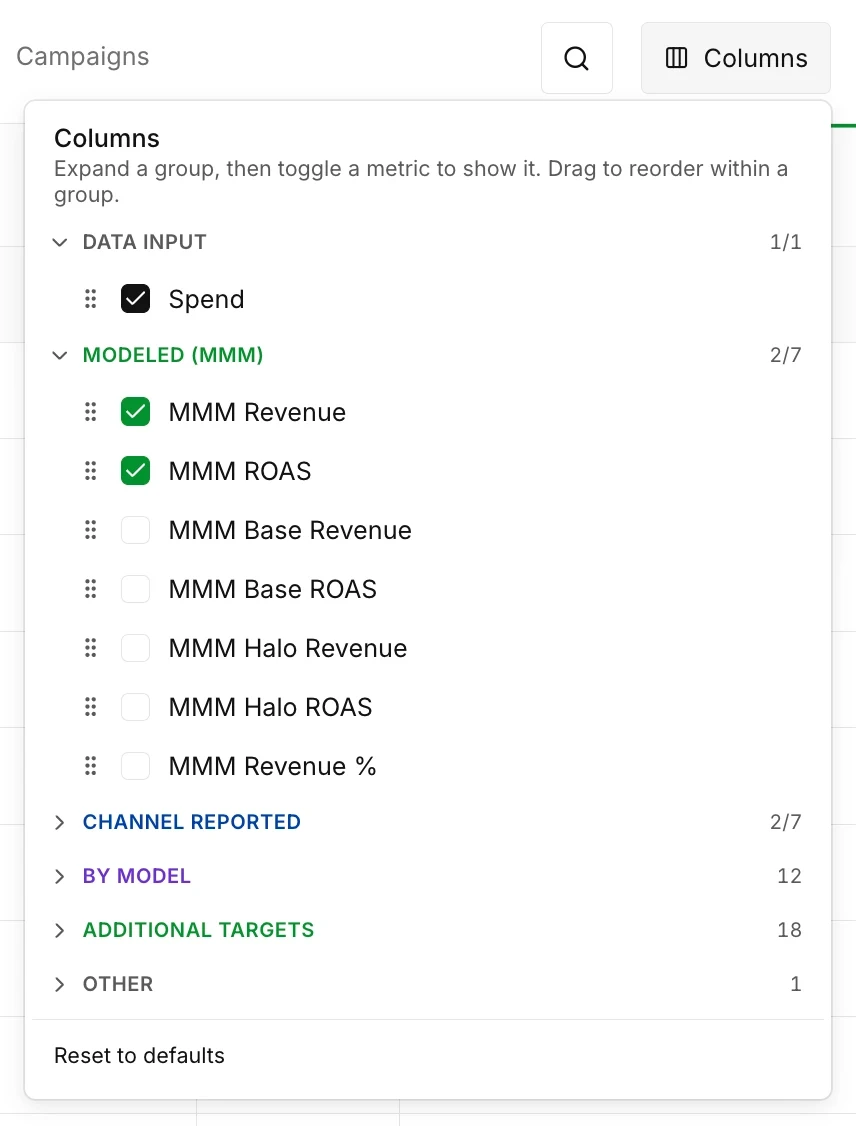
Section titled “How do you change the columns?”The Columns menu lists each metric of the table in a group. In the capture, two groups are open and four groups are closed.
-
Select Columns above the table.
-
Expand a group, then turn a metric on or off.
-
Drag a metric to change its position in the group.
-
To restore the default columns, select Reset to defaults.
Every column that is not in the default set is off until you turn it on.
To change the width of a column, drag the edge of its heading. To move a whole group of columns, drag the band above the group to a new place. To keep a set of columns, see Save and share a view.
How do you compare a modeled figure with a channel-reported figure?
Section titled “How do you compare a modeled figure with a channel-reported figure?”The table groups its columns by the source of the figure. Read the two groups side by side for the same row.
- Modeled (MMM) holds the figures from your marketing mix models: the total, Base, and Halo.
- Channel Reported holds the figures that the ad platform reports for itself.
Ad platforms each take full credit for an outcome, so the channel-reported figures of all channels overlap. The total of these figures is typically more than the modeled total. See Modeled and reported figures.
How do you open the details of one row?
Section titled “How do you open the details of one row?”Select the arrow before the name of a row. A panel opens under the row. Select the arrow again to close the panel.
The name of the row does a different job. On the Channels tab and the Tactics tab, the name opens the campaigns of the row.
The panel has up to three views.
- Saturation shows the modeled response curve of the row and a spend scenario. The panel opens on this view when the row has a curve. See Explore a spend scenario.
- Compare shows two metrics over time for the row.
- Attribution shows the Base and Halo flows of the row.
What does the Marginal column show?
Section titled “What does the Marginal column show?”The Marginal column shows the modeled efficiency of the next unit of spend on the row. The column name ends with the efficiency metric of your target.
On the Campaigns tab, an arrow next to the value compares the value with the average modeled efficiency of the same row. Hold the pointer over the arrow to read the comparison. An arrow that points right means that the two values are within 5% of each other.