

Where the daily recommendation comes from
An explanation of the plan behind the recommendation card, when the card appears, which rows it lists, and what the Last week pill compares.
The recommendation card is not written for the screen. It is a summary of a real Media Forecaster plan. This page explains which plan that is, what the card selects from it, and how the screen selects the Last week pill.
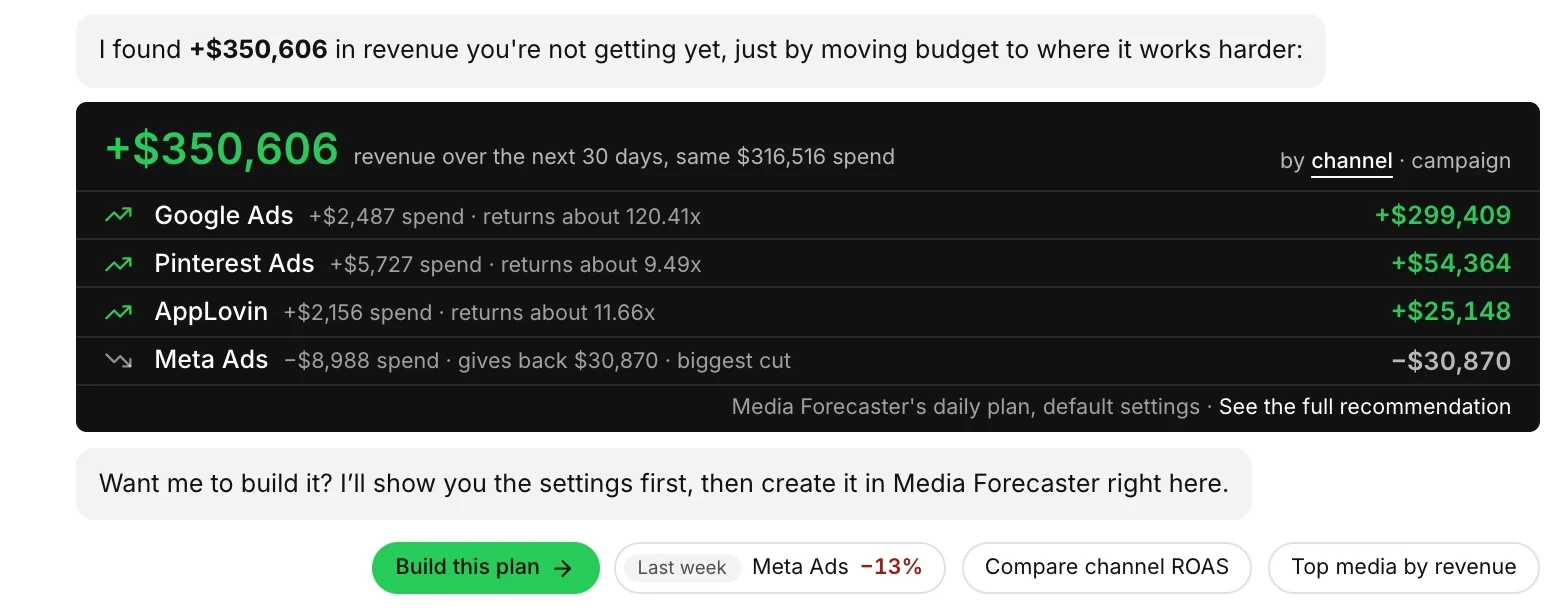
The capture shows the card of the daily recommendation with a row for each channel.
Which plan does the card summarize?
Section titled “Which plan does the card summarize?”Media Forecaster runs one plan for your workspace each day with default settings. The card quotes the plan of today when that plan is complete. If the plan of today is not complete, the card quotes the most recent complete daily plan.
The last line of the card says so: it names the daily plan of Media Forecaster and its default settings, and links to Media Forecaster. The same recommendation is at the top of the Media Forecaster page.
The plan covers the next 4 weeks when your models are weekly, and the next 30 days when your models are daily.
When does the card appear?
Section titled “When does the card appear?”The card appears only when the plan found a gain. Two conditions must be true.
- The plan expects more of your outcome than the baseline.
- One or more channels gain from more spend.
When the plan finds no gain, the screen has no card and no Build this plan pill. The closing line then asks what you want to look at.
Which rows does the card list?
Section titled “Which rows does the card list?”The card lists the rows where more spend gives more of the outcome. It does not list a row whose gain comes from less spend, because the card recommends where to add budget.
- Up to 3 rows that gain, with the added spend and the expected return of each.
- 1 row with the label biggest cut, the row from which the plan takes the most spend.
- One line for the other rows together, when their share of the gain is large enough to matter.
The rows and that line add up to the gain at the top of the card. When your workspace has campaign rows, a control on the card changes the list between channels and campaigns.
Why are the figures modeled figures?
Section titled “Why are the figures modeled figures?”The gain on the card is the difference between two forecasts of the same models: the forecast of your current mix and the forecast of the recommended mix. It is not a reported figure and not a promise. For the full explanation, see How Media Forecaster builds a plan.
What does the Last week pill compare?
Section titled “What does the Last week pill compare?”One reply pill has the label Last week. The pill names the channel, or the tactic, whose modeled outcome changed most from one week to the next, with the change as a percentage.
The screen selects the row by the size of the change in the outcome, not by the percentage. A small channel that doubles does not come before a large channel that falls by a tenth.
| Rule | Value |
|---|---|
| Last week pill | The pill shows the channel or tactic whose modeled outcome changed most in absolute terms. A row needs a change of 0.5% or more. |
| Last week, daily models | The 7 days up to the last modeled day, compared with the 7 days before. |
| Last week, weekly models | The last complete model week, compared with the week before. |
The comparison uses your main target. The main target is revenue when your workspace has a revenue model, and the first target of your models in other cases.
Why does the screen look different for each workspace?
Section titled “Why does the screen look different for each workspace?”Each part of the screen depends on data. The connection rows, the notes about models, the card, the row list, and each pill appear only when the data supports them.