

Performance Table options
Reference for the Attribution Performance Table, with each table level, column group, export option, and row detail view.
This page lists the options of the Performance Table section and of the details of a row. For the columns of the table, see Metrics and summary cards.
In a label on this page, a word in braces is a value that depends on the account. The outcome is the name of the target, for example revenue. The efficiency is the efficiency metric of the target, for example ROAS.
The capture shows the section on the Channels tab, with the spend column and the modeled columns.
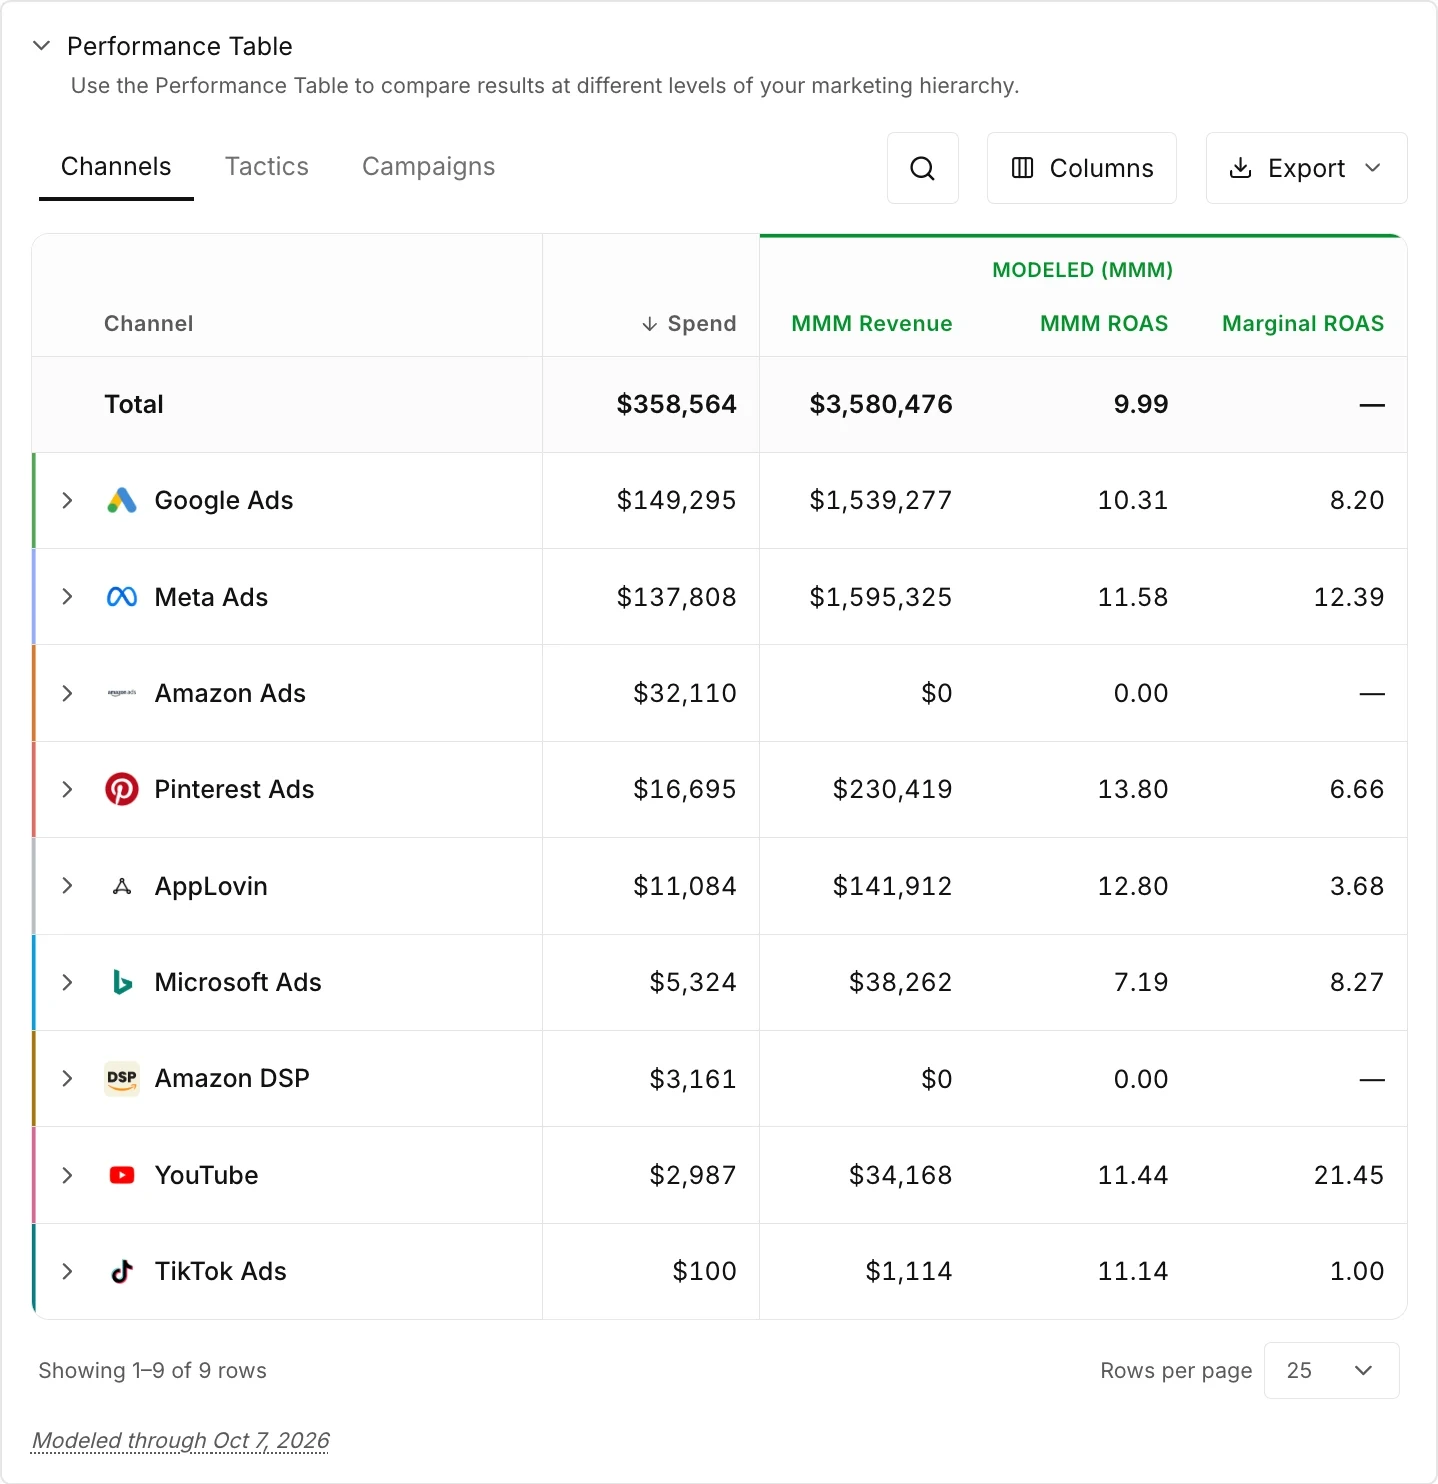
Table levels
Section titled “Table levels”| Tab | Rows |
|---|---|
| Channels | One row for each channel. This tab is the first tab. |
| Tactics | One row for each tactic. |
| Campaigns | One row for each campaign. |
Column menu groups
Section titled “Column menu groups”| Group | Columns |
|---|---|
| Data input | Spend. |
| Modeled (MMM) | The modeled columns for all selected models together, and MMM {outcome} %. |
| Channel Reported | The figures that each ad platform reports. |
| By model | With 2 or more models, one sub-group for each model with the modeled columns of that model. |
| Additional targets | Modeled columns from a different target of your account. A target with 2 or more models has an Aggregate sub-group and one sub-group for each model. |
| Other | Columns with no group, for example Campaign ID. |
A word in braces stands for a value from your account or your plan.
Export options
Section titled “Export options”| Option | What the file contains |
|---|---|
| Export with visible columns only | A CSV of the table with the columns that are on screen, except Marginal {efficiency}. No export contains that column. |
| Export with all columns | A CSV of the table with every available column. |
| Export periodic data | A CSV with the full periodic breakdown for the current view. You select the period first. |
| Export channel spend breakdown | A CSV with the full periodic spend breakdown for each channel. You select the period first. |
A word in braces stands for a value from your account or your plan.
Marginal efficiency arrow
Section titled “Marginal efficiency arrow”| Arrow label | Meaning |
|---|---|
| Better than average | Green. The title of the arrow reads Higher than average MMM {efficiency} for a ratio such as ROAS, and Lower than average MMM {efficiency} for a cost such as CAC. |
| Near average MMM {efficiency} | Amber, with an arrow that points right. The marginal value is within 5% of the average. |
| Worse than average | Red. The title of the arrow reads Lower than average MMM {efficiency} for a ratio such as ROAS, and Higher than average MMM {efficiency} for a cost such as CAC. |
| Comparison unavailable | Gray, with an arrow that points right. The product has no direction for the campaign. |
| Marginal {efficiency} unavailable | A gray dot. The campaign has no curve. |
A word in braces stands for a value from your account or your plan.
Table rules
Section titled “Table rules”| Rule | Value |
|---|---|
| Default columns | Spend, MMM {outcome}, MMM {efficiency}, Channel {outcome}, and Channel {efficiency}. The table also shows Marginal {efficiency} after the modeled columns. Every other column is off until you turn it on. Reset to defaults restores this set. |
| Marginal column position | Each tab adds Marginal {efficiency} after the last modeled column. |
| Default sort | Spend, from high to low. |
| Sort | A column heading sorts the table by the column. A second selection reverses the order. With Compare on, a metric column has four states in turn: value from high to low, value from low to high, change from high to low, and change from low to high. Marginal {efficiency} has no change and keeps the two value states. |
| Rows per page | 5, 10, 25, 50, or 100. The default is 25. |
| Campaigns of one row | The name of a row on the Channels tab or the Tactics tab is a link. The link opens the Campaigns tab with only the campaigns of that row, and a banner names the row. |
| Details of one row | The arrow before the name of a row opens or closes the details of the row. The name of the row does not open the details. |
| Tab change | A change of tab clears the search and the campaign banner. |
| Order of the column groups | A drag of a band above the columns moves the whole group of columns to a new place in the table. |
| Export rows | The two table exports contain each row that matches the filters, on every page of the table, with the Total row first. With Compare on, each metric also has the figure of the comparison period and the change. The periodic export has no Total row. |
| Column width | A drag of the edge of a column heading changes the width of the column. |
A word in braces stands for a value from your account or your plan.
Row details
Section titled “Row details”Row views
Section titled “Row views”| View | What it shows |
|---|---|
| Saturation | The modeled response curve of the row, with a spend scenario. The panel opens on this view when the row has a curve. |
| Compare | A chart of two metrics over time for the row. |
| Attribution | The Base and Halo flows of the row. |
Model confidence values
Section titled “Model confidence values”| Value | Meaning |
|---|---|
| Strong | The range is tight and the actual results agree with the curve. |
| Moderate | The range is usable, or the history is too short to check the curve. |
| Directional | The range is wide, or the spend is beyond any spend in the history. |
Tooltips in the row details
Section titled “Tooltips in the row details”The table gives the text that the product shows in a tooltip of the row details.
| Label | Tooltip |
|---|---|
| Seasonal Forecast | Projects the saturation curve using expected seasonal demand, so you can plan spend around upcoming peaks and dips. Covers the next {N} days. |
| Model confidence | Trust in the curve at the selected spend. Strong — tight range, actuals agree. Moderate — usable range, or too little history to check. Directional — wide range, or spend beyond anything observed. |
| Confidence band | The shaded range shows where actual {outcome} is likely to land at each spend level. A tighter band means a more certain estimate. |
| Explore Spend Scenario | Explore different spend scenarios with the slider, or enter an exact spend or percentage change. |
A word in braces stands for a value from your account or your plan.
Row detail rules
Section titled “Row detail rules”| Rule | Value |
|---|---|
| Open a row | The arrow before the name of a Performance Table row opens or closes the panel. On the Channels tab and the Tactics tab, the name of the row opens the Campaigns tab and does not open the panel. |
| First view | Saturation when the row has a curve. Compare when the row has no curve. |
| Compare view granularity | The same rule as the main chart: day is available only when all selected models are daily. |
| Scenario limit | The scenario spend stops at 1.5 times the highest spend in the history of the row, or at the end of the curve when that is lower. For a spend above the highest spend in the history, Model confidence is Directional. |
| History on the chart | Dots on the chart are the modeled periods of the history of the row. A period with a modeled outcome above the range of the chart shows as a triangle on the top edge, and a line under the results gives the number of such periods. |
| Curve of a tactic row | When a tactic has 2 or more modeled curves, a menu above the chart selects the curve. |
| Curve point | The chart tooltip reads Observed for a spend inside the history of the row and Extrapolated for a spend beyond the history. |
Messages
Section titled “Messages”The table has these messages.
| Message | When it shows |
|---|---|
| Viewing: {name} campaigns | The banner on the Campaigns tab after the selection of a row name on the Channels tab or the Tactics tab. |
| No channel data for the selected filters. | The Channels tab has no data for the period and the filters. |
| No channels match your search. | The search on the Channels tab has no match. |
| No tactic data for the selected filters. | The Tactics tab has no data for the period and the filters. |
| No tactics match your search. | The search on the Tactics tab has no match. |
| No campaign data for the selected filters. | The Campaigns tab has no data for the period and the filters. |
| No campaigns match your search. | The search on the Campaigns tab has no match. |
A word in braces stands for a value from your account or your plan.
The details of a row have these messages.
| Message | When it shows |
|---|---|
| Unable to load the saturation curve. | The Saturation view when the curve did not load. |
| Unavailable for this campaign and model selection. or Unavailable for this tactic and model selection. or Unavailable for this channel and model selection. | Tooltip of Seasonal Forecast when the row has no seasonal curve. |
| Campaign saturation curves are unavailable for this model selection. or Aggregate saturation curves are unavailable for this model selection. or Tactic saturation curves are unavailable for this model selection. | The Saturation view when the selected models have no curve for the row. |
| No attribution flow for this row. | The Attribution view when the row has no flow. |
Related
Section titled “Related”- Attribution: the guides and the concepts of the product area.
- Compare channels, tactics, and campaigns: the steps to use the table levels.
- Explore a spend scenario: the steps for the details of a row.
- Export Attribution data: the steps to export the table.