

Model Health reference
Reference for a model detail page, with the header controls, the run statuses, and each metric and chart series of the Model Health tab.
This page lists the parts of the detail page of a model and of its Model Health tab.
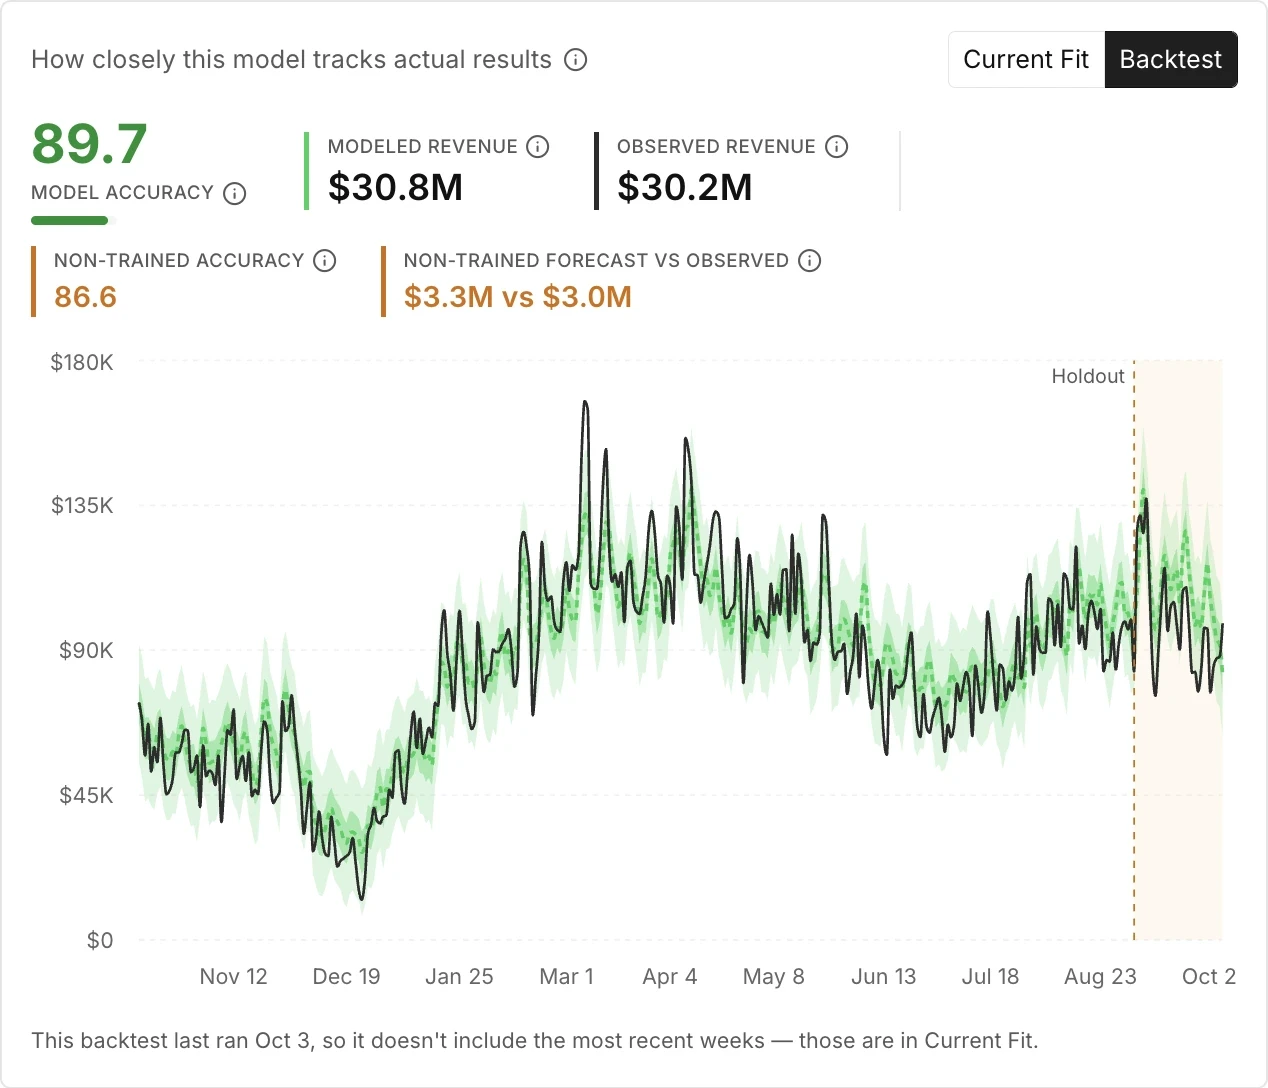
The capture shows the Model Health tab in the Backtest view.
In a label on this page, a word in braces is a value from the account. The target is the outcome that the model measures, for example revenue.
Detail page
Section titled “Detail page”| Tab | What it shows |
|---|---|
| Model Health | The fit of the model against reported results. The page opens on this tab the first time. |
| Attribution | The Attribution sections for this one config. |
Header row
Section titled “Header row”The header row shows the channel, the segment badge, the number of configs, and these controls.
| Control or rule | Value |
|---|---|
| Config selector | The selector shows when the target has 2 or more configs. Default is first. The other configs follow in alphabetical order. |
| Target selector | A different target opens the config of that target for the same channel. |
| Compare configs | The button always shows. The comparison opens with the Default config as Model A and the first other config as Model B. |
| Attribution tab | The tab shows the Attribution sections for this one config. The tab has no filter bar. |
| Config that you cannot open | The product shows the page-not-found page for a config that does not exist or that your workspace cannot see. |
Run statuses
Section titled “Run statuses”The config selector and the run status panel show the status of the last run of a config.
| Status | How it shows |
|---|---|
| Completed | Green check icon. |
| Running | Amber icon. The run status panel can show Est. finish. |
| Failed | Red icon. |
| Skipped | Gray icon. |
| Not run | No icon. The label shows when the config has no run status. |
The product shows these labels without a description.
Run status panel
Section titled “Run status panel”The panel opens when the pointer is over the help icon in the header row.
| Row | What it shows |
|---|---|
| Last run | The status of the last run. |
| Run started | The start time of the run. The row shows only when a start time exists. |
| Est. finish | The estimated finish time. The row shows only while a run is in progress. |
| Last run completed | The time that the last run finished. The row shows Not run when no run finished. |
| Average runtime | The average duration of a run. The row shows Unknown when no value exists. |
| Modeled through | The last date that the model has results for. The row shows Not available when no date exists. |
Model Health tab
Section titled “Model Health tab”The tab has the caption How closely this model tracks actual results and a toggle between two views.
| View | What it shows |
|---|---|
| Current Fit | The current model against reported results, through the last modeled date. This view opens first. |
| Backtest | A separately trained model against reported results, through the end of its test period. The view gives one score for the dates that the model trained on and one score for the dates that it did not train on. |
| Rule | Value |
|---|---|
| First view | Current Fit. |
| Non-trained metrics | Non-trained Accuracy and Non-trained Forecast vs Observed show only in the Backtest view, and only when the backtest has a period that the model did not train on. |
| Backtest chart legend | The Backtest chart has no legend. Hold the pointer over the chart to see the series. |
| End date of the backtest | The Backtest view ends where the test period of the last backtest ends, so the view does not include the most recent weeks. A line under the chart gives the date when the backtest last ran. |
Current Fit metrics
Section titled “Current Fit metrics”| Metric | What it shows |
|---|---|
| MMM Fit | How closely the modeled values follow the reported totals in the selected period, from 0 to 100. |
| Modeled {target} | The total that the current model predicted for the selected period. |
| Observed {target} | The total that your sources recorded for the selected period. |
A word in braces stands for a value from your account or your plan.
Backtest metrics
Section titled “Backtest metrics”| Metric | What it shows |
|---|---|
| Model Accuracy | The fit of the backtest model on the dates that it trained on, for the dates that the view shows, from 0 to 100. |
| Modeled {target} | The total that the backtest model predicted for the dates that the view shows. |
| Observed {target} | The total that your sources recorded for the dates that the view shows. |
| Non-trained Accuracy | The score for the most recent period that the backtest model did not train on. The value does not change with the selected period. The metric shows only when the backtest has such a period. |
| Non-trained Forecast vs Observed | The forecast and the recorded result for the same period, as 2 values. The metric shows only when the backtest has such a period. |
A word in braces stands for a value from your account or your plan.
Chart series
Section titled “Chart series”| Series, Current Fit | What it shows |
|---|---|
| Reported | The values that your sources reported. |
| Modeled | The values that the model predicted. |
| 50% interval | A band around the modeled line. The band shows only when the model has this interval. The product gives no definition of the band. |
| 95% interval | A wider band around the modeled line. The band shows only when the model has this interval, and its label can read Interval. The product gives no definition of the band. |
| Series, Backtest | What it shows |
|---|---|
| Forecast | The values that the backtest model predicted. |
| Reported | The values that your sources reported. |
| Holdout | The start of the period that the backtest model did not train on. |
Tooltips of the Model Health tab
Section titled “Tooltips of the Model Health tab”The table gives the text that the product shows for each metric and for the information icon next to the caption. The texts are the words of the product, not a retraining schedule. The line under the Backtest chart gives the date when the backtest last ran.
| Metric | Text in the product |
|---|---|
| Current Fit and Backtest | Current Fit runs through the latest modeled date and includes data the model has already seen (in-sample). Backtest scores a separately retrained model on data it never trained on and reruns about monthly, so it ends earlier (out-of-sample). |
| MMM Fit | How closely your current model's predictions track reported totals over this window. Higher is better, on a 0 to 100 scale. |
| Modeled {target}, Current Fit | Total {target} the current model predicted across the selected date range. |
| Observed {target} | Total actual {target} recorded across the selected date range. |
| Model Accuracy | An estimate of how accurately this model forecasts future performance, learned from your historical data. Higher is better, on a 0 to 100 scale. |
| Modeled {target}, Backtest | Total {target} the model predicted across the selected date range. The closer it is to Observed, the more accurate the model. |
| Non-trained Accuracy | Accuracy over the most recent ~30 days (about 4 weeks) the model did not train on. It stays fixed regardless of the date range above. |
| Non-trained Forecast vs Observed | What the model forecasted versus what actually happened during that non-trained 30-day window. |
A word in braces stands for a value from your account or your plan.
Empty states
Section titled “Empty states”- Current Fit: No fit data available for this configuration.
- Backtest: No backtest results available yet.
Related
Section titled “Related”- Model Center: the guides and the concepts of the product area.
- Read the health of a model: the steps to read the two views.
- See the attribution of one model: the steps for the Attribution tab.
- Accuracy and fit: what each score and each view measures.